
The Torvik Ratings are one of the most valuable and easy-to-use tools this time of year for March Madness betting. I use this college basketball analytics site, often referred to as “BartTorvik,” daily throughout the season and during The Big Dance.
While no betting resource is a magic pill, the Torvik Ratings are a top-notch resource and they provide a few advantages over the more heralded Pomeroy Ratings known as “KenPom.” Below you can read some key differences between these two popular college basketball analytics sites. You can also read my full write up of the KenPom rankings by clicking here.
What Are The Torvik Ratings?
Found at barttorvik.com, the Torvik ratings were created by a lawyer with a love for data named (you guessed it) Bart Torvik. The Torvik rankings go all the way back to 2008, but around 2015 the site really started to gain popularity.

The power rankings, known as “T-Rank,” are the most popular feature of the website and they’re also the first thing you notice when you visit. All 364 Division 1 men’s college basketball teams are included from Alabama to Youngstown State.
Successful sports bettors prefer T-Rank to more traditional poll rankings because they remove bias from voters and account more accurately for strength of opponent. The most commonly cited individual metrics on the power rankings are Adjusted Offensive Efficiency (ADJOE), Adjusted Defensive Efficiency (ADJDE) and Adjusted Tempo (ADJ T).
Bart Torvik vs. Ken Pom
The power rankings at BartTorvik.com are similar are similar to KenPom’s figures because they use many of the same core metrics, however they’re not identical. For instance, at the time this article was published, both websites had the same six teams in their top 6, but in a slightly different order with Duke being on top of both rankings.
BartTorvik separates itself from KenPom by adding recency bias and placing less emphasis on games that happened more than 40 days ago. After 40 days, games lose 1 percentage point of emphasis until they’re 80 days old. After 80 days, all games have 60% weight compared to the most recent games. It’s debatable whether this tweak makes the Torvik Ratings more accurate, but I'm a fan. For more information on the mathematical differences between BartTorvik and KenPom, click here.
BartTorvik also has a power rankings and other data for women’s college basketball, while KenPom focuses solely on men’s basketball.
How To Use Torvik Ratings
What makes the BartTorvik particularly helpful is that users can easily splice data to determine T-Rank for a specific period of time.
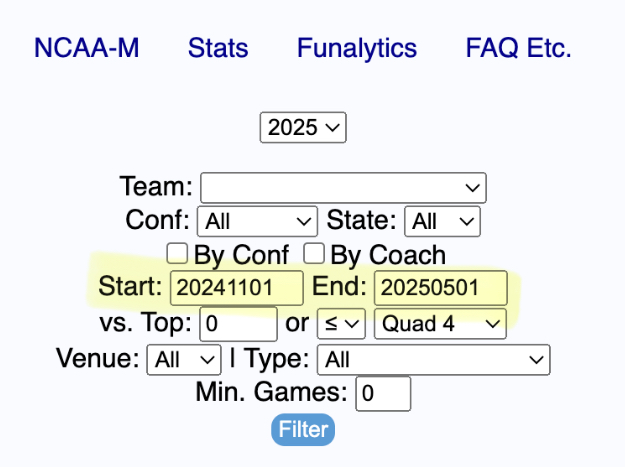
By inserting dates into entry fields at the top of the website, much like you use while flight shopping, bettors can measure a team’s performance for a unique length of time.
This is particularly useful for answering questions like: “Who are the best teams, according to analytics, over the last month?” or “How has Providence been since they lost Bryce Hopkins for the season back in December?”
Once we get later in the tournament, you can set the Torvik ratings parameters from March 19 (just before Round 1 of the tournament) to present day and see which teams have performed best so far in the tournament. These parameters produce an extremely small sample size of two games, but it's noteworthy because playing under pressure in March is different.
How To Use Bart Torvik's Player Data
Those who like to build college basketball Same-Game Parlays (SGPs) with several individual players will also appreciate Bart Torvik’s “Player Stats” page (located at the top of the main page under “Stats.” Here you can easily see who the best and worst players in the country are in a variety of categories (assists, offensive rebounds, defensive rebounds, etc.) and you can also sort by specific points in time as described above.
If a player is out of the lineup and you’re wondering how valuable they are to the roster, Bart Torvik’s “PRPG!” metric is an excellent resource. The acronym stands for Points Over Replacement Per Adjusted Game At That Usage. You can think of this metric like baseball’s WAR (Wins Above Replacement) data point. Villanova’s Eric Dixon, Ohio State’s Bruce Thornton, and Drake’s Bennett Stirtz rank atop this metric in 2025, so live bettors should keep that in mind if they get into foul trouble.


